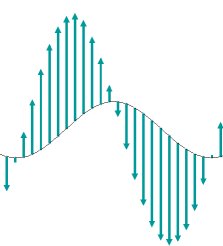
This display object consists of a single point, and up to three vectors bound to that point displayed in a two dimensional space. The point can occupy a static position or it can be animated by attaching its horizontal and vertical components to data columns. Likewise, each of the bound vectors is defined by specifying either fixed values or data column values for their horizontal and vertical components, respectively. Any of the data columns in the current session, whether collected from a sensor or generated using Video Analysis, can be used to define these objects. In the example shown below the point is driven by displacement and time columns of data collected in a simple harmonic oscillation experiment. The vector displays the velocity column.
You can add a new animated display to your page by choosing Meter > Animated Display from the Insert menu.
Choose Open from the File menu, then open Experiments\Sample Data\Physics\Animated Display Vectors\SimpleHarmonicWithVecs.cmbl to access a sample experiment.

The default animated display displays a single point having fixed position (0,0) in the center of a symmetric coordinate space spanning a range of 50 to -50 identical but arbitrary units in both dimensions. If the window is resized such that it is no longer square, the horizontal range and VMin of the vertical range are unchanged but VMax is computed to maintain a symmetric space. The animated display point, vectors and other display properties can be changed using the animated display options dialog which is accessed by double-clicking on the object or by choosing Animated Display Options from the Options Menu.