Gel Electrophoresis is a method used to separate biological molecules based upon molecular charge (polarity), molecular mass, and molecular shape. This is particularly useful in separating charged biomolecules such as deoxyribonucleic acid, DNA, and ribonucleic acid, RNA. Analysis feature calculates the number of base pairs of various molecules based on the distance traveled during electrophoresis.
Choose Gel Analysis from the Insert menu, and select either Take Photo or From File. Take Photo is a live method of capturing your gel results using a ProScope, Logitech, or other digital camera. Choose From File to select a gel photograph stored in your computer.
 .
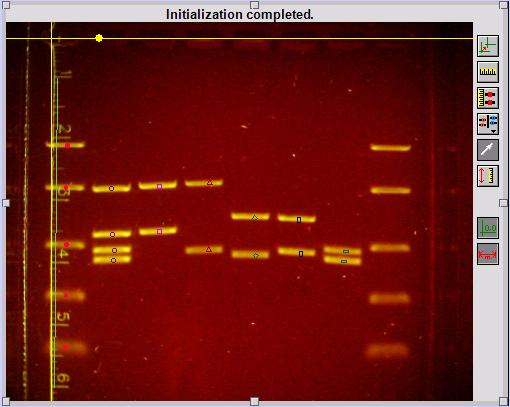
Position your cursor to the left of the first well and click. A yellow
origin will appear where vertical and horizontal lines intersect. Drag
the origin up or down to position the horizontal line in the middle of
all the wells. Use the dot on the horizontal line to rotate, if needed.
.
Position your cursor to the left of the first well and click. A yellow
origin will appear where vertical and horizontal lines intersect. Drag
the origin up or down to position the horizontal line in the middle of
all the wells. Use the dot on the horizontal line to rotate, if needed. .
Use
your cursor to draw a line of known distance on the photo. A window
will appear allowing you to input the distance of the line you draw.
This step is optional. If it is skipped, distances will be reported in
pixels.
.
Use
your cursor to draw a line of known distance on the photo. A window
will appear allowing you to input the distance of the line you draw.
This step is optional. If it is skipped, distances will be reported in
pixels.  , then click
the center of
the first band of the Standard Ladder in the photo. Enter the number of
base pairs in the window that appears. Click the next band and repeat
for all bands in the standard ladder.
, then click
the center of
the first band of the Standard Ladder in the photo. Enter the number of
base pairs in the window that appears. Click the next band and repeat
for all bands in the standard ladder. and then the Add
Lane option.
Click the center of the first band of the first experimental lane. The
number of base pairs will be calculated and entered in the data table
and on the graph. Click on each of the remaining bands in this lane.
and then the Add
Lane option.
Click the center of the first band of the first experimental lane. The
number of base pairs will be calculated and entered in the data table
and on the graph. Click on each of the remaining bands in this lane.